User Story Mapping
A story map is a way to lay out user stories so they still tell a story. Jeff Patton introduced the idea in a 2005 article, “It’s All in How You Slice It”, named and illustrated the practice in a 2008 article, “The New User Story Backlog is a Map”, and wrote the book — User Story Mapping: Discover the Whole Story, Build the Right Product — in 2014.
Its stated job is product framing and release slicing. But something else happens while you do it: the room starts arguing about the domain. That is the thesis of this page.
Story mapping discovers domain knowledge as a side effect of organising work — coarser than EventStorming, and from the user’s point of view rather than the business’s.
That sentence is my reading of the material, not a claim you will find in Patton. The rest of this page tries to be clear about which parts are documented and which parts are interpretation.
User Story Mapping – Product thinking made fun, practical, & profitable
What a story map is
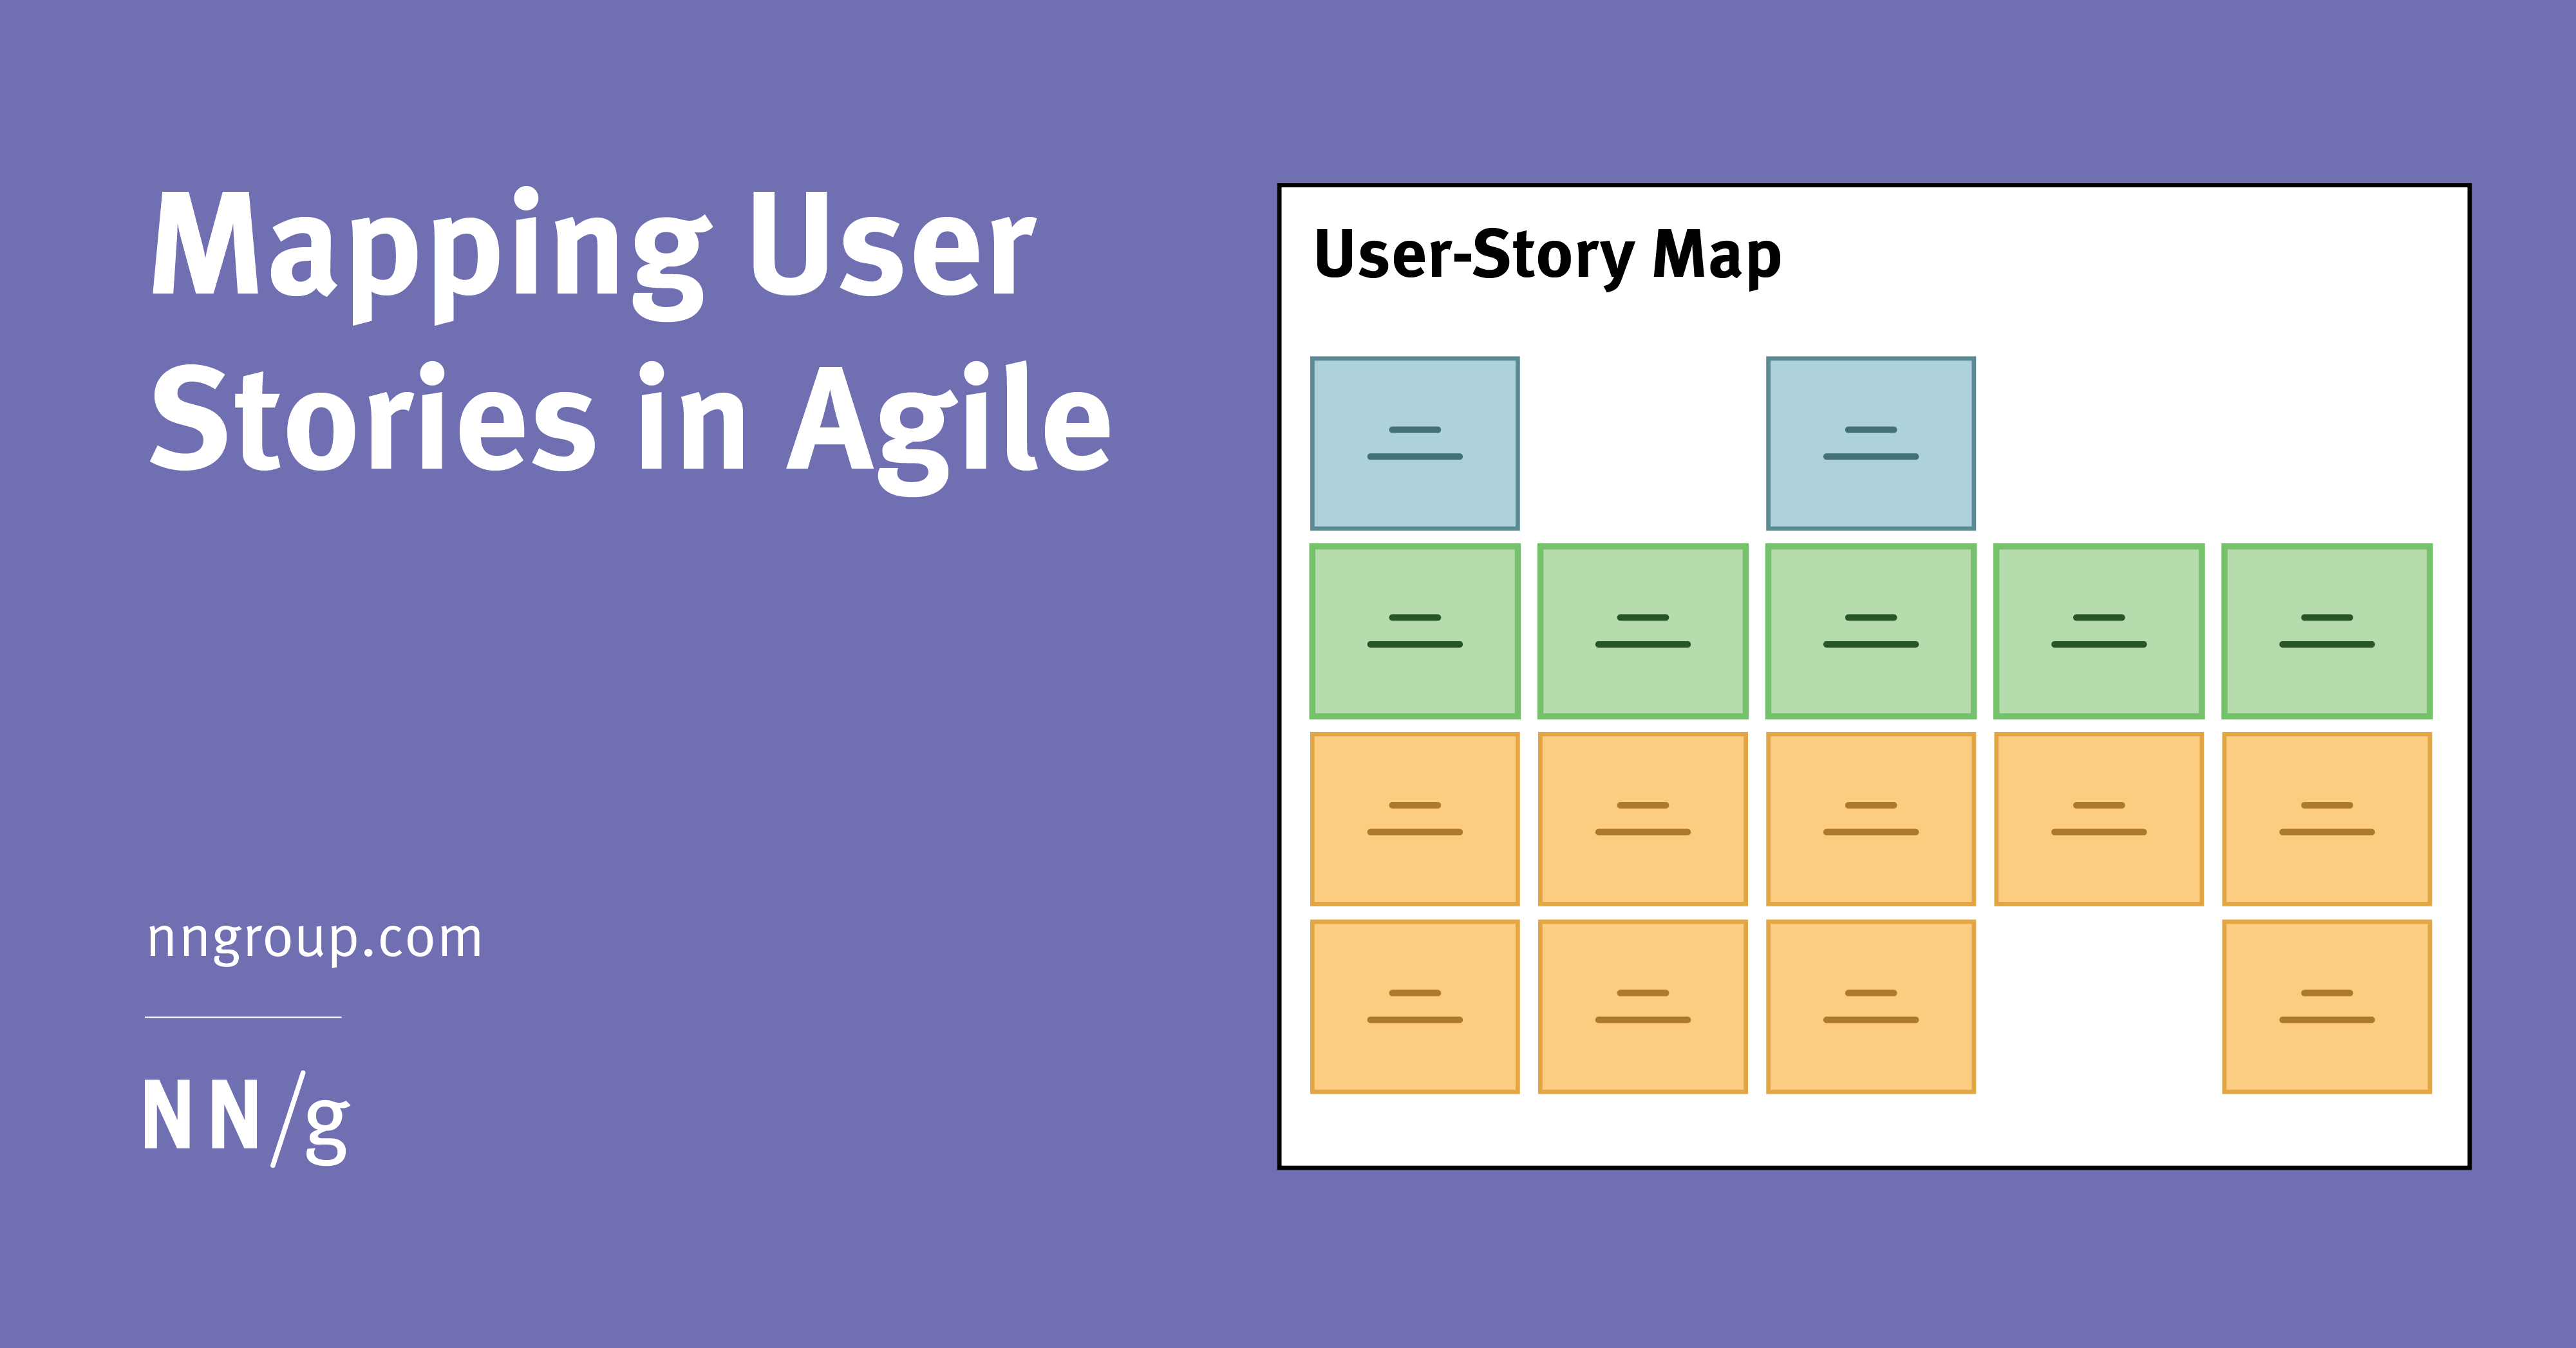
A story map arranges user stories along two independent axes.
- Horizontal: user activities, in the order a user would actually perform them. Patton calls this row the backbone. His ordering heuristic is memorable: the order you would explain the behaviour of the system in is the correct order.
- Vertical: variations and detail, ordered by priority. The top row across the whole backbone is a walking skeleton — the thinnest usable path through the entire product.
Horizontal cuts through the map become release slices. That is where the planning value lives.
The vertical axis gets described differently by different authors, which is worth knowing before you read three sources and think they disagree. Patton and the Agile Alliance stress priority and increasing sophistication; Nielsen Norman Group describes stacked details in priority order; other writers stress the alternative ways a user could do a step. These are emphases on one axis, not competing definitions. “Variations and detail, ordered so the top row is the thinnest usable path” reconciles all of them.
One vocabulary caveat, stated plainly because precision matters here. The web sources confirm backbone, user activities, user tasks and walking skeleton. The term “narrative flow” and the strict three-level activity → task → detail hierarchy are book vocabulary that I could not confirm on any independent page. If you want those terms, take them from the book — User Story Mapping: Discover the Whole Story, Build the Right Product, Jeff Patton with Peter Economy, O’Reilly, 2014 — and not from a blog post repeating them.

What is Story Mapping?
The problem it solves
Patton’s target is the flat, prioritised backlog. He names three things it does badly.
- It communicates badly. A flat list cannot explain what the system does as a whole. His metaphor: we pull all the leaves off the tree and load them into a leaf bag. The result is context-free mulch.
- It hides gaps. A linear list gives you no confidence that you have found all the functionality you need. It leaves, in his words, “the nagging feeling that there’s something I’m missing”.
- It makes prioritising miserable. Planning a release across hundreds of flat stories becomes hours of meetings stepping through each one.
The second failure is the interesting one for this page. “I don’t know what I’m missing” is not a planning problem. It is a discovery problem. And that reading is Patton’s own framing, not mine — he is describing a map as an antidote to incomplete knowledge:
A user story map arranges user stories into a useful model to help understand the functionality of the system, identify holes and omissions in your backlog, and effectively plan holistic releases that deliver value to users and business with each release.
Jeff Patton on his site User Story Mapping
The New User Story Backlog is a Map – Product thinking made fun, practical, & profitable
How it facilitates domain discovery
Here is the honest position, up front, because burying it would be dishonest and because it is what makes the rest of this section trustworthy.
Patton never uses domain-driven design vocabulary. Eric Evans never mentions story mapping. Nobody who invented either practice built the bridge between them. The bridge is built by named practitioners: Eriksen Costa, writing on InfoQ in 2015, and Dion Stewart, whose peer-reviewed Domain-Driven Design with User Story Mapping workshop ran at XP 2019.
Costa’s conclusion is that story mapping “can be a simple yet valuable pattern for a DDD adoption in projects dealing with complex domains”. Stewart’s workshop takes a complementary line. It uses user journeys to drive collaboration around ubiquitous language, defining the domain, evolving the model and establishing context. From there it works towards bounded contexts, aggregates, entities, domain events and commands.
Two named practitioners, two venues, no citation relationship between them. That is real support. It is not doctrine.
So it helps to separate the mechanisms that are documented from the ones that are a reasonable reading.
| Mechanism | Status |
|---|---|
| Gap detection — the map exposes holes the flat backlog hides | Documented. Patton’s own words (above) |
| Dependency exposure — you stop shipping a high-value feature made unusable by a deferred dependency | Documented. Agile Alliance glossary |
| Sequence reveal — left-to-right order exposes the real process | Documented as product-use order. Reading that as the domain’s process is inference |
| Activities and tasks as candidate domain concepts | Interpretation, with practitioner support (Stewart) |
| Ubiquitous language emerging from arguing about the words on the cards | Interpretation, with practitioner support (Costa, Stewart) |
| Unknowns treated as domain questions | Interpretation. Borrowed from Example Mapping’s red question card, which is documented. Not story-mapping doctrine |
The mechanism underneath the interpretive rows is Patton’s own principle that a shared document is not a shared understanding. Signing off a specification creates the belief in agreement while the interpretations quietly diverge. The remedy is conversation around a shared external model. In my experience that is exactly where domain knowledge falls out: a cross-functional group has to agree, out loud and in public, on the words for each activity, their order, and what is missing. Disagreements about vocabulary become visible because someone has to write a word on a card.
That is a real discovery mechanism. It is also a coarse one. It surfaces the user’s view of the domain, because the horizontal axis is a user journey. It will not give you the parts of the business no software touches — that is what EventStorming and Domain Storytelling are for. If you want the domain-modelling side of this argument in its own terms, start with domain-driven design.
Combining User Story Mapping with Domain-Driven Design
Where it sits among adjacent practices
Story mapping is one of a family of collaborative modelling practices. Each has a primary source, and each describes only itself — so the definitions below are solid, and the ordering that follows is not.
| Practice | Originator | What it produces |
|---|---|---|
| Impact Mapping | Gojko Adzic | Goal → actors → impacts → deliverables, as a mind map |
| EventStorming | Alberto Brandolini | Collaborative exploration of a whole business domain, in four flavours |
| Domain Storytelling | Stefan Hofer, Henning Schwentner | Pictographic sentences: actor → work object → actor, numbered |
| User Story Mapping | Jeff Patton | Two-axis map of user activities, plus release slices |
| Event Modeling | Adam Dymitruk | Timeline of events, commands and views, ending in Given-When-Then |
| Example Mapping | Matt Wynne | Rules, examples and questions for one story, in about 25 minutes |
People like to order these by “zoom level”: impact mapping widest, example mapping narrowest, with EventStorming, domain storytelling, story mapping and event modelling in between. Treat that as my framing, not a canonical ranking. No source ranks all six on one scale, and at least one of these sites makes no comparative claims at all. It is a useful mental model for choosing a workshop. It is not a hierarchy anybody agreed to.
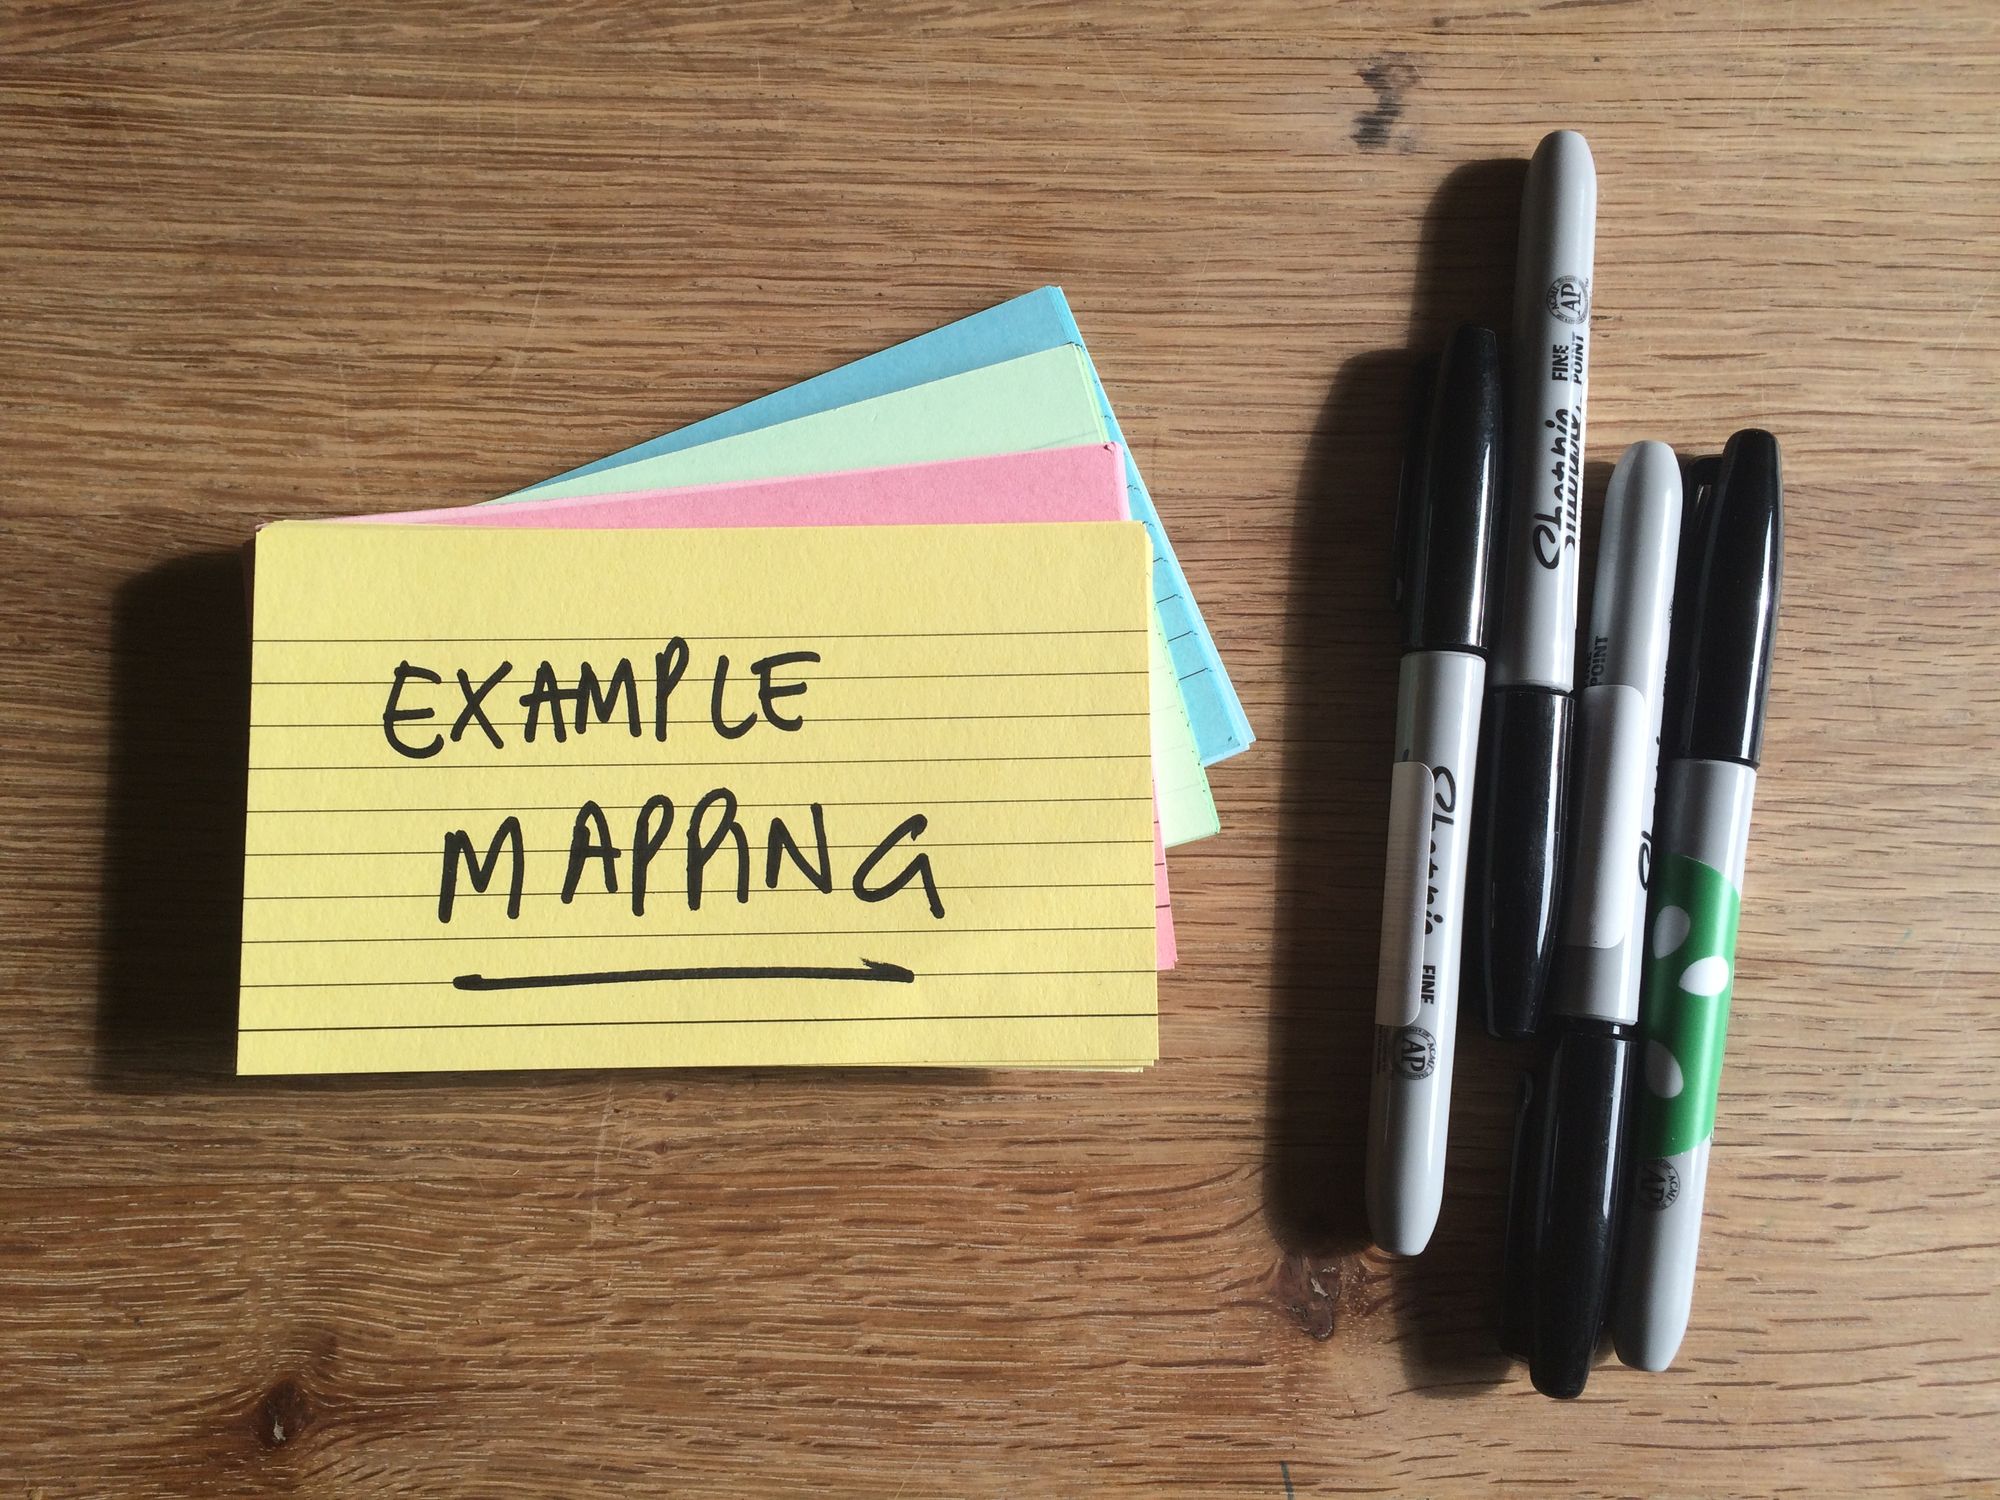
One relationship is clean, and it is the one that matters most in a BDD knowledge base. Example Mapping’s own introduction places it before formal scenario writing, working on one story at a time in a short timebox. Story mapping’s unit of work is the whole product. So they are not competitors: story mapping produces the stories that Example Mapping then interrogates one at a time. Both sides of that sentence come from primary sources.
Story mapping is also the only practice in the table whose stated purpose includes planning and slicing. That is worth noticing when you pick between them. If you want the next zoom level in, see discovery workshops.
Introducing Example Mapping | Cucumber
Map the whole product, or map what you need?
This is the most interesting tension in the material, and it is not a disagreement between camps. It is the same author, thirteen years apart.
In 2008, the point of a map was that it spanned the whole product. Don’t lose the big picture. The backbone runs end to end precisely so you can see everything at once and notice what is absent.
By 2021, Patton — interviewed on The Product Experience — calls mapping everything “boiling the ocean” and lists it as a mistake. Map at the altitude of the decision you are making. He says people struggle with the altitude question a lot, and offers a functional test for what counts as a step: something you would do with the intention of completing it before moving on to do something else.
Nielsen Norman Group reached the same place independently: breaking story maps into manageable scopes and segments is often better than tackling an entire large-scale product in one map.
The two positions are reconcilable, and I think the reconciliation is the actual lesson. The big picture the 2008 article defends is a property of the map’s shape, not of its size. A narrowly scoped map still has a backbone, still has a walking skeleton, and still shows you the holes. What changes is the altitude. A map of everything is not more honest than a map of one feature; it is just more expensive, and it goes stale faster.
Read as a progression, the practice moved from “map the whole product so you don’t lose the big picture” to “map at the altitude of the decision you are trying to make”. That is maturing guidance, not a contradiction.
Mapping User Stories in Agile
Limits, honestly scoped
Two limits deserve stating clearly, because most writing about story mapping does not state them.
There is no empirical evidence that story mapping works. Not “the evidence is weak” — there is none in the trusted literature. No controlled study, no measured experience report, no academic evaluation. Every benefit claim on this page, including Patton’s, is practitioner assertion. That does not make it wrong; a great deal of good practice is transmitted this way. It does mean you should hold it as craft knowledge rather than as a finding.
There is no substantial independent published critique either. The documented limits come from the originator and from UX practitioners, not from adversaries.
The pitfalls that are documented are Patton’s own, from that 2021 interview. The biggest, in his words, is mapping without understanding your users. Next is having too many or the wrong people in the room: you cannot build a map from scratch with a crowd, though a crowd can usefully talk about one already on the wall. Third is scope anxiety, where people avoid writing down options because they fear anything recorded is now committed. That last one quietly defeats the map’s whole purpose as a surface for exploring options.
Nielsen Norman Group adds two more. Avoid letting a single role dominate. And frame each item by what the user is doing, not by what the product is technically doing for them.
You will also hear that story maps get mistaken for Gantt charts or work breakdown structures, that they go stale as one-off artefacts, and that big-batch mapping is an antipattern. I could not source any of these. They are commonly-repeated folklore, and I am listing them as folklore rather than as findings. Patton’s interview touches adjacent ground — some teams keep maps alive by wiring them to their tracker, so the map changes colour as work progresses — but he never uses the Gantt framing.
Getting started with User Story Mapping – Jeff Patton on The Product Experience
Other resources
Jeff Patton, “User Stories & Story Mapping Demystified”:
Patton’s two-page quick reference, his note on branches in maps (useful for the “a map is not a flowchart” point), and the originating 2005 article, It’s All in How You Slice It.
The book is User Story Mapping: Discover the Whole Story, Build the Right Product, Jeff Patton with Peter Economy, O’Reilly, 2014:
